Creating a new card
You can create a new report card by clicking Add:
You will see the Add Report Card side panel show on the right side of the screen. This is where you will create your report card.

When on the Visualisation tab you will notice a report preview display appear; this will be blank until you select the Module and Primary Display By value.
Once these values have been selected the graph preview on the left updates in real-time while you filter the data. You will then be able to update the secondary display, date property, measure by, comparisons, fixed date range and filters.

Visualisation Tab Meanings
- Title: This is a mandatory field and will appear as the title for your report card.
-
Card Type: This is the type of graph you want to display your data in. You can find out more on these here.
-
Module: You need to select a module when creating your report card. This module contains the type of information you want display. You can choose from these options: Candidate, Contact, Company, Job, Advert & Lead
-
Primary Display: This is the main data that will display on your Report Card - essentially what you are reporting on. If using a graph card, this would be the X Axis on your graph.
-
Secondary Display: This allows you to stack or split the data from your Primary display into subsections.
-
Date Property: This allows the data in your card to be further filtered using a specific date, for example Follow Up Date, Activity Date or Created Date.
-
Measure By: Allows you to select what your card is count - For example, this could be a count of Actions taken in the system or a Monetary value associated to sales. If showing as "Count" this may be locked and will be showing number of Actions.
-
Compared To: On each card you have the option of choosing if you'd like to view comparison data for the previous period. By default, no comparison is shown.
Comparison data is viewable for Bar, Column, Line and KPI charts only, and only if you have a Date Property selected.
- Date Range: By default, cards will use the same date range as the global dashboard date filter ("Dashboard Filter"). However, you can choose to show a data for a different date range on a card-by-card basis.
-
Filters: Using Filters on your data selection lets you further refine the data that is showing in your graphs.
If you click into the Filters box, a dropdown will appear showing all the filters that you can apply to your selected data. The filters you can choose from will vary depending on which data Module and Display you have selected. You can search directly in the Filters box to quickly find a filter you are looking for.
Example Report Card Build
Example: You are a looking to build a Report Card showing how many Calls actions each of your recruiters have completed over a certain period.
To Build your card, you'd select:
- Primary Display: Activity User
- Secondary Display: Candidate Activity
- Date Property: Activity Date
- Measure By: Count
- Compared to: No Comparison
- Date Range: Dashboard Filter (or set period if you would like to lock the date range)
- Filters: Select all the Call Activities you would like to review

You should now find a full built card showing your stacked data - if you do wish to show each of the activities separately, you can untick the "Stacked" option at the top of the graph.
Data Tab
Selecting the Data tab provides deeper insights on what exact data the graph is showing.
Each module has default columns selected and any Primary Grouping or Filter that is selected will also select the corresponding column as default.

To get more information on on the graph, you can add in new Columns within the Data tab and the additional information will show.

You can check the box next to any of the options and this will allow you to add these as a column to your report.
Click Save in the bottom right of the preview window to save any changes.
Editing a card
You can remove or edit a card by clicking the ellipsis icon (…) at the top right of the card and selecting Edit or Remove:
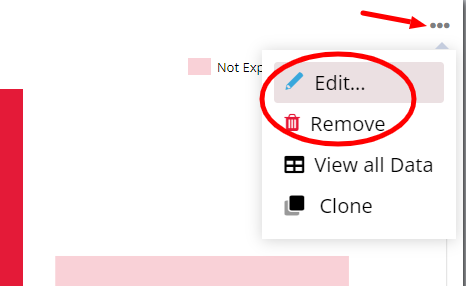
When editing the side panel will show again, allowing you to make updates to the card.
Cloning a card
You can clone a report card by selecting the ellipsis icon at the top right of the card and then selecting Clone:
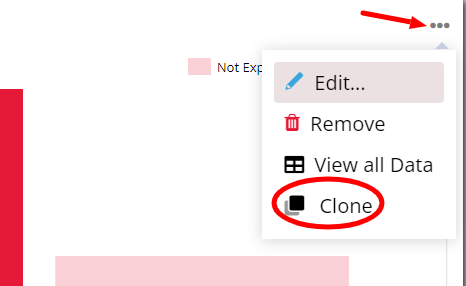
The 'Clone Report Card' side panel will then open and allow you to name the report card and select the dashboard that this should be cloned to.
By default, the report card name will be the same as the card that has been cloned with ‘(2)’ added to the end.
There is the option to clone the cards to:
- The current Dashboard
-
Other Dashboard (an existing Dashboard that you have permission to edit)
-
A New Dashboard
If you are cloning to a new dashboard, pressing save will take you to the ‘New Dashboard’ side panel. This is where you can name the new dashboard and choose the sharing and permissions that should be applied.
Once save has been selected the cloned card will show on the selected dashboard.