Report Dashboards in Firefish give you a flexible way to track performance, spot trends, and measure success across key areas of your business. Whether you want to build a dashboard from scratch or tailor a shared view, this guide shows you how to access, create and manage your Reports Dashboards step by step.
Click to jump to the section you'd like to learn more about:
- Accessing your dashboard
- Creating, editing and deleting a dashboard
- Default dashboards
- Filtering your dashboard
- Sharing your Dashboard
- Dashboard Limits & Viewing Permission Options
Already created your Dashboard? Create some Cards or select from Pre-Built Cards to populate your report!
Accessing your dashboard
To access your Reports Dashboard, go to Analyse > Reports Dashboard in the main menu:

You’ll notice there are already some cards on your Dashboard – these are the default cards and can be edited or removed at any time.
You can drag and move the cards around and resize them easily using the cursor. The colours used on your dashboard are based on your chosen Firefish colour scheme.
Creating, editing and deleting a dashboard
Creating a new dashboard
Within Analyse > Reports Dashboard; click on Actions at the top of the page and select +Add:

Next, you'll have the option the name your dashboard, set the sharing options and set the permissions for users who can access the dashboard.

Choose from one of the following sharing options:
- Private: the dashboard will only be visible to you.
- Team: select a Team who'll be able to view the dashboard.
- Everyone: all users will be able to view the dashboard.
Choose the permissions for any user who can view the dashboard:
- View Only: any user with visibility of the dashboard will not be able to make any changes.
- View and Edit: any user who has visibility of the dashboard will be able to change the dashboard name and edit/add/remove report cards.
Once you've decided on your dashboard settings, click Save to create the dashboard.
Your new dashboard will be added to the list of available dashboards. Now it's time to create report cards on your dashboard.
Editing a dashboard
When viewing a list of dashboard you have visibility of, click the Actions button, and then the blue pencil icon to edit a dashboard:

For your own dashboards, you can always edit the name, sharing options and permissions as well as the report cards within the dashboard.
For dashboards where you have 'View and Edit' permission, you can edit the name of the dashboard as well as the report cards within the dashboard.
For dashboards where you have 'View Only' permission, you won't be able to edit the name or report cards within the dashboard.
Deleting a dashboard
You're only able to delete a dashboard which you have created. To do this, simply click the Actions button, then the delete icon, then Confirm:

Default dashboards
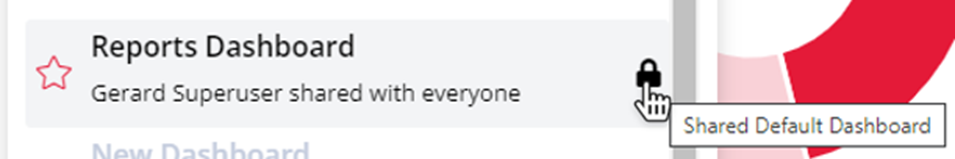
Shared default dashboard
The shared default dashboard is shared with Everyone, as detailed above, and it can’t be deleted. This dashboard is indicated with the padlock symbol next to its name in the dropdown menu.
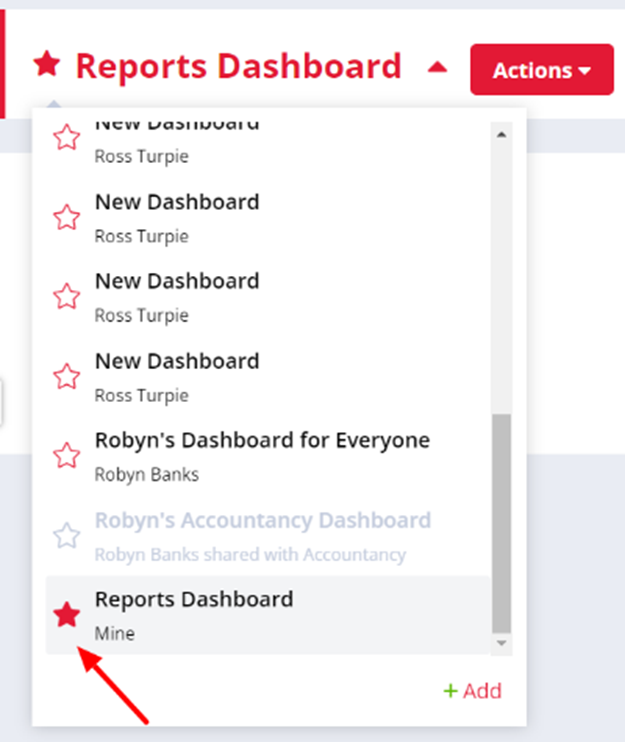
Setting your default dashboard
You can set your default dashboard by clicking the star icon to the left of the dashboard name - this will then become the dashboard you see each time you go to Analyse > Reports Dashboard:
Filtering your dashboard
You can choose the data you want to see using the Viewing for filter at the top where you can filter by date range, user and/or team.

Filtering by date range
When filtering by date range, you can select a time block (this week, last week, etc.) or a custom date period.
![]()
Using a custom date period you can then choose to compare to the previous year or the previous date range.
For the other date ranges the comparison date will be:
- Today, the data will be compared to yesterday
- This week, the data will be compared to last week
- This month, the data will be compared to month
- This Quarter, the data will be compared to last quarter
- This Year, the data will be compared to last year
When All Time is selected as the date range there will be no comparison, as there will be no data to compare to.
Within the date range filter you also have the option to choose the frequency at which your data will be displayed. The options for this are:
- Daily
- Weekly
- Monthly
- Quarterly
The frequency that has been selected will show on the global date range filter and Line, Bar or Column Charts, in brackets after the selected date range.
Filtering by user
When filtering by user, you can choose to view data for just one user or select multiple users and this will clearly show how the data compares between users.
Note When no users are selected, the dashboard will show data for all users.
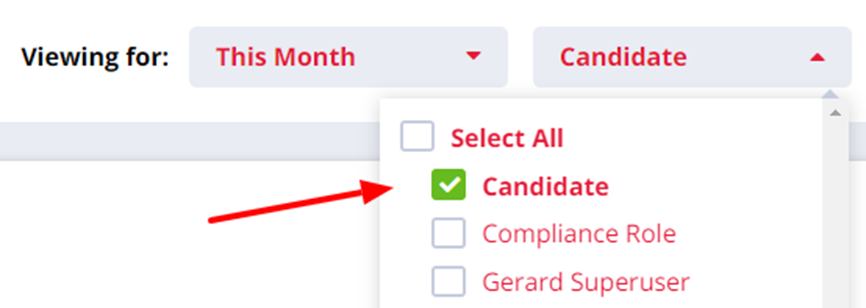
You can also filter by ‘Candidate’ which will include all Web and Advert registrations as these actions are performed by a candidate:
Filtering by team
When filtering by team, this will automatically pull up data for all individual users in that team. Remember, Teams can be managed via the Team Structure page.
Super Users control which users can view and export data on the Reports Dashboard.
To manage user dashboard visibility & exporting, go to Settings > User Management > User Permissions.
Here, you’ll see an option to choose which users can View Other Users’ reports. This gives you the option to limit whether users can see only their own data or also data of their team members.


Sharing Your Dashboards
You can share a Reports Dashboard with other users in Firefish either by copying a link or sending it via email.
To share:
-
Select the dashboard and click Share.

-
Choose Copy Link to send a view-only or view & edit URL.
-
Or select Email Dashboard, enter the recipient’s address, and click Send.
💡 Note: Users must have permission to view or edit the dashboard. If the Send button is disabled, check your email settings.
Dashboard Limits & Viewing Permissions
See table below for information on how many Dashboards you can have, and who you can view with.
| Site Type | Basic | Professional | Enterprise |
| Number of Dashboards | 3 | 4 | 5 (per site) |
| Viewing Permission Options |
|
|
|
If you would like to increase the number of Reports Dashboards available, get in touch with your Firefish Success Manager!