Here's what we've released in April
CRM
Potential Matches Settings – Split out for Permanent & Contract Job Workflows
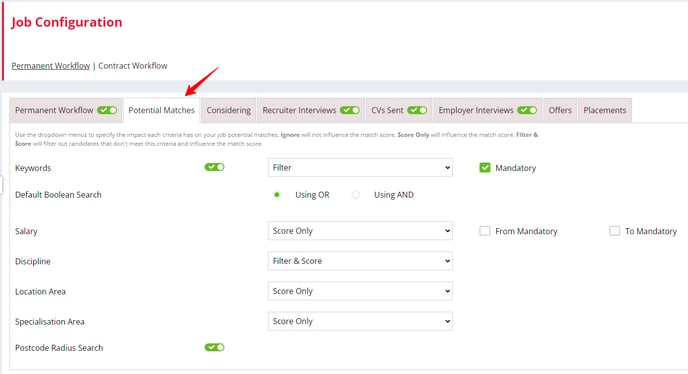
The original ‘Potential Matches’ settings page has been removed and separated into potential matches settings unique to both ‘Permanent’ & ‘Contract’ workflows.
The new potential matches settings will be housed within both ‘Permanent Workflow’ and ‘Contract Workflow’ as their own tabs. These tabs can be found by within Settings > Job Configuration.
This will give you complete control over what matches will show for each job workflow, without impacting the other workflow.
Fish Tank Article(s)
- https://fishtank.firefishsoftware.com/job-configuration-potential-matches
- https://fishtank.firefishsoftware.com/manage-job-potential-matches
Integrations
SMS Received Actions now Displaying the correct Site’s System Logo
Version: Enterprise
For Enterprise customers with multiple sites, when an SMS is sent out from Firefish, the subsequent reply will now display the same website’s system logo as the SMS that was originally sent (instead of defaulting to the Primary Site only).
This means you’ll be able to tell how many replies each website is receiving.
Fish Tank:
Analytics
Date & Sales Comparisons
Version(s): Basic/Professional/Enterprise
We are now bringing comparison data directly into the charts you can create on the Reports Dashboard. Previously you could see comparisons on the tooltip but this wasn’t very clear.
When setting up the cards, you can compare to the Previous Period (e.g. if the global dashboard filter is set to ‘This Month’ it will show you comparison data for ‘Last Month’) using the new dropdown option. By default this is set to ‘No Comparison’.
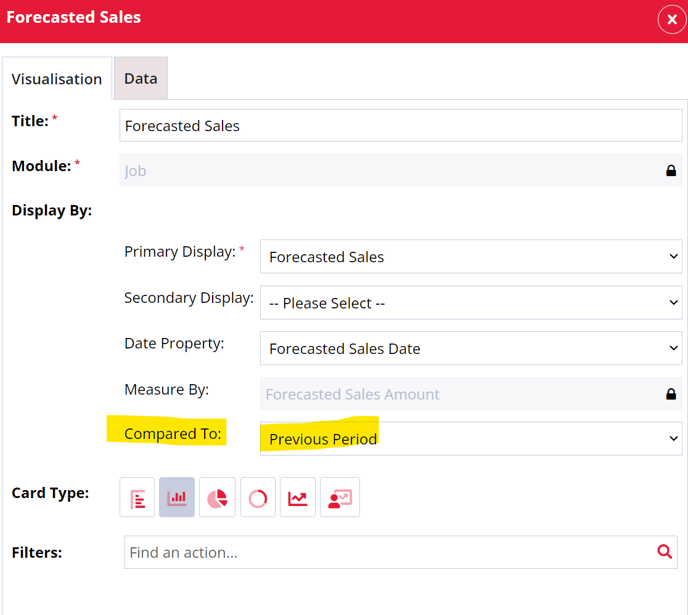
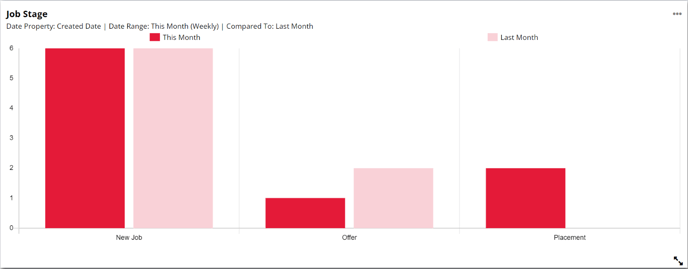
If the global dashboard filter is set to All Time then no comparison data will show, as there is no ‘Previous Period’ to compare to. Users setting up the cards will get a warning telling them this.

Forecasted Sales
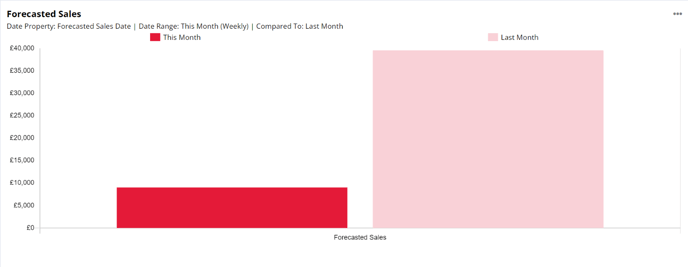
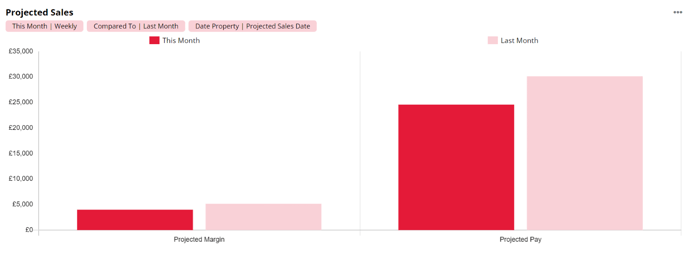
As part of this update users can now report on Forecasted Sales in the dashboard and compare these sales to the previous period.
Fish Tank Article(s)
- https://fishtank.firefishsoftware.com/reports-dashboard-graphs-and-charts
- https://fishtank.firefishsoftware.com/reporting-on-sales
Web
UI Updates – Header Menu, Logo, Recently Viewed
Version(s): Basic/Professional/Enterprise
The CRM’s UI has been updated in the following locations:
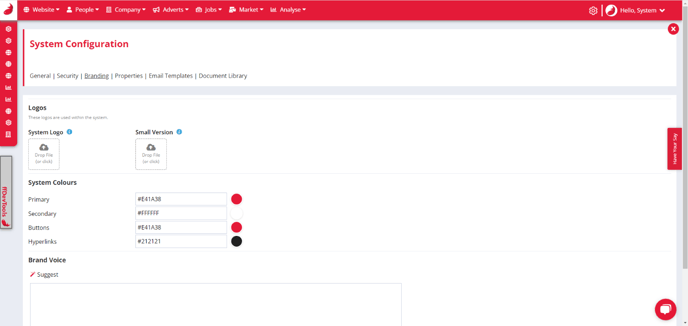
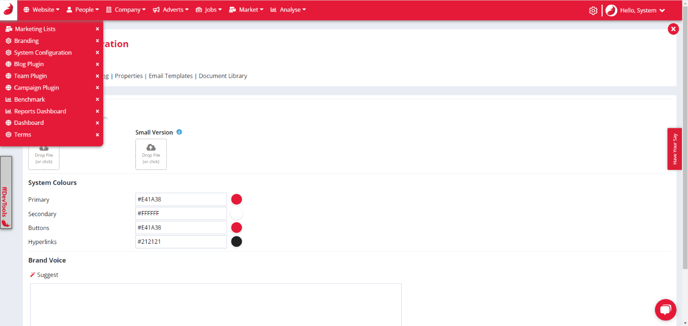
Header & Logo
The header has been reduced in height, and the small version of the branding logo will now be used (configured in System Configuration > Branding). If no logo has been provided, a Firefish fish logo will now be used.
Recently Viewed
The Recently Viewed sidebar is now collapsed by default and can be expanded on hover. We’ve also narrowed down the sidebar and reduced the number of links to 10.
CRM
Contact Merge
Version(s): Basic/Professional/Enterprise
The CRM team are excited to be releasing the contact merge feature, allowing users to perform a contact merge within Firefish. This will save both us and our clients time, as no more data tickets will have to be raised and worked on for contact merges.
Users can decide what user roles will have the permission to perform a contact merge within User Management > User Permissions.
The contact merge action will also be available to be report
The contact merge follows the same workflow as candidate merge:
- Navigate to the chosen contact record
- Select ‘Tasks’
- Select ‘Merge’ within the ‘Tasks’ pop-up window.
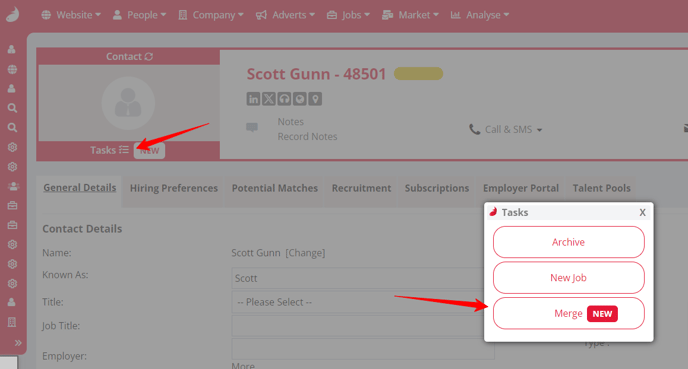
This will present the user with a familiar pop-up window where they can select the contacts they wish to merge:
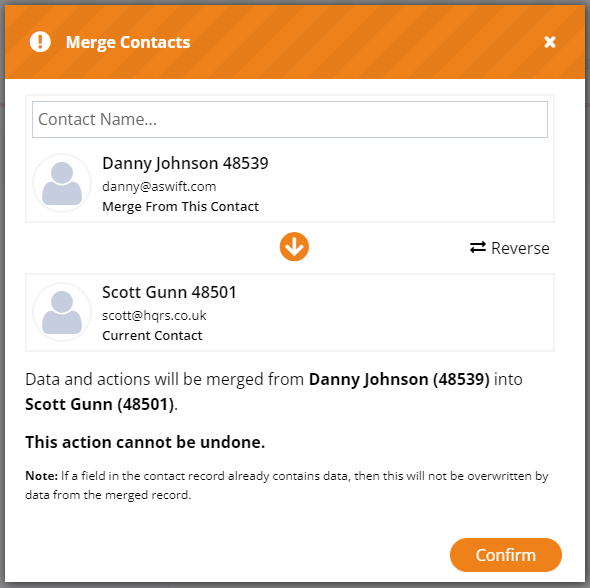
Contact merges within the system are based off the contact merge tool used by Data. The only difference being that contacts will now be hard deleted when merged.
Unless the contact is a dual record, in that case they will de-activated.
Fish Tank Article(s)
Analytics
Small Improvements to Reports Dashboard
Version(s): Basic/Professional/Enterprise
We have made several smaller changes to the Reports Dashboard:
Subheadings
The subheadings on the cards that show the Date Range, Compared To and Date Property information have been visually updated. They now show in a coloured box which takes the secondary colour that is already used on the dashboard.
Labels
Users can now see a checkbox called ‘Labels’ when setting up or editing cards. Checking this box shows the numerical labels on the chart, making it easier to see totals without having to hover over or look across to the y-axis.
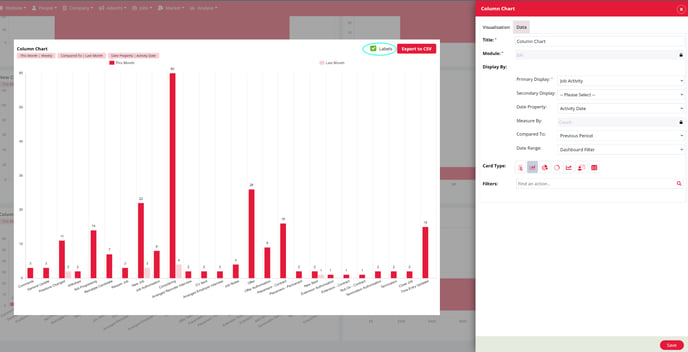
These can be used on Bar, Column, Pie, Donut and Line Charts. When charts have the option to be stacked, the label shows the total for that grouping.
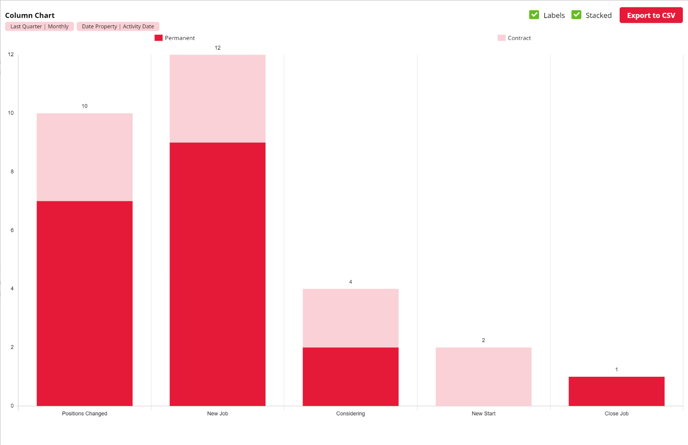
Table Cards
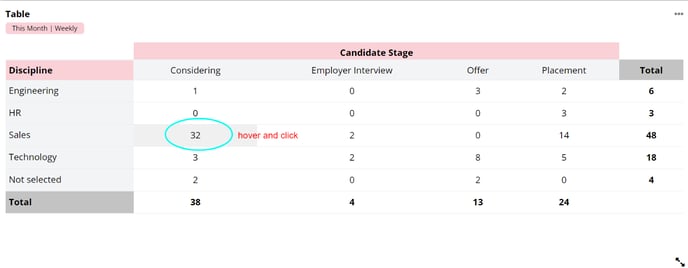
We have a new card type available that presents data in a table format. It can be used with one or two groupings, and hovering over data and clicking works the same as a segment click where you can view that specific data.

Individual card date range filter
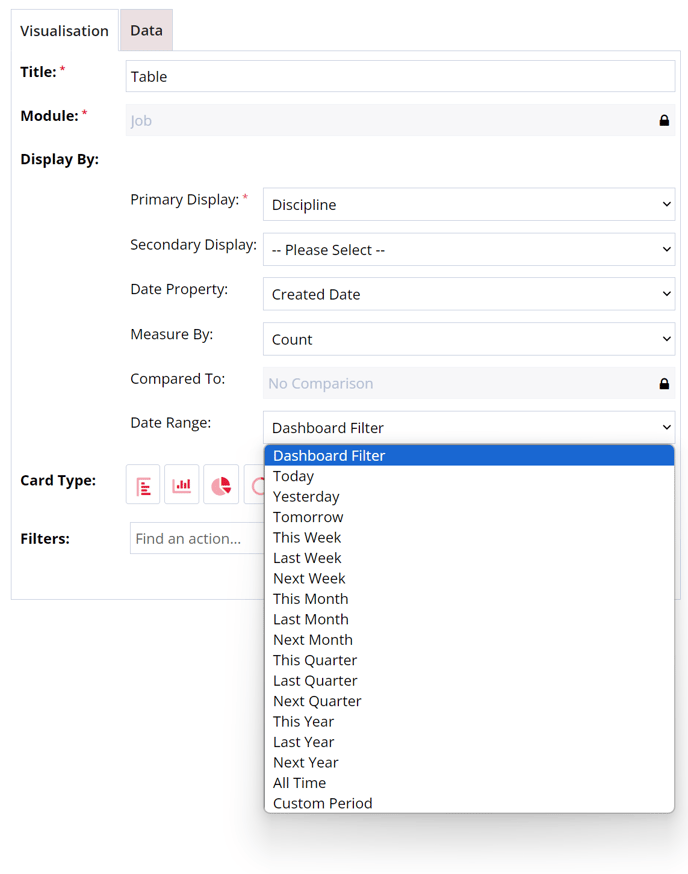
Users now have the option to set date range filters for individual cards on the dashboard. By default, all cards will use the Dashboard filter, but this can be changed on a card-by-card basis using the new Date Range dropdown.
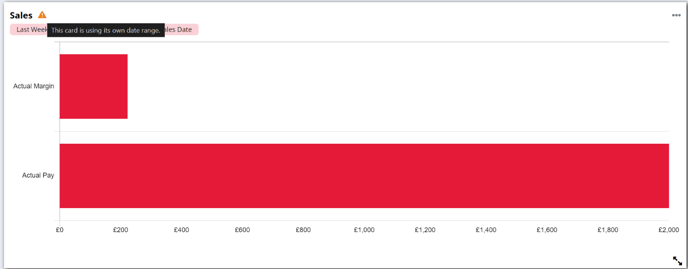
When a card uses its own date range and not the dashboard, a warning triangle shows on the card to remind the user that this card is using its own date range. When the global dashboard filter is changed, any cards using their own date range remain unchanged.
Fish Tank Article(s)
Sales Comparisons
Version(s): Basic/Professional/Enterprise
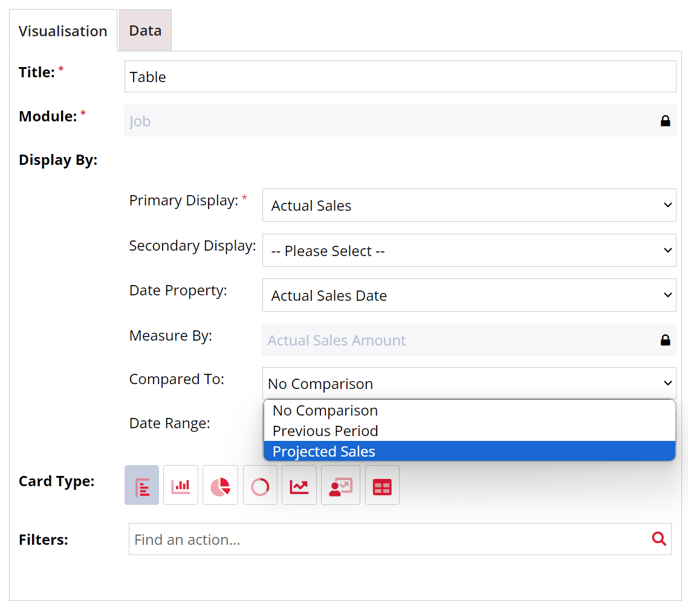
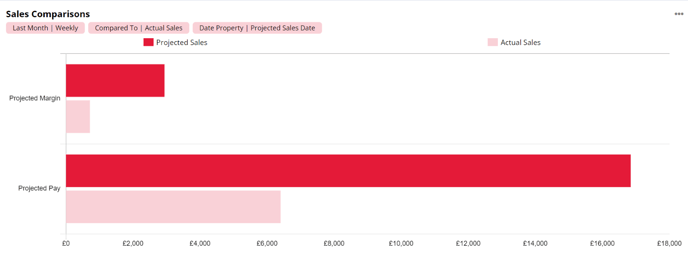
Users can now compare different sales figures within the Reports Dashboard, for example Actual and Projected Sales. When a sales type is selected as the Primary Grouping, the alternative sales type is available to select from the Compared To dropdown.
Fish Tank Article(s)